Regional Climate Projections for Europe
Global climate change has different regional impacts; its effects are already noticeable today. Mankind will need to adapt to those future changes. To investigate possible regional climate changes in Europe in the 21. Century and to develop adaption strategies, regional climate simulations are performed. The Climate Service Center Germany (GERICS) is involved in the development of various models and methods to provide local climate change information. The simulated model results are stored at the DKRZ and can be downloaded from there through the ESGF (esgf-data.dkrz.de). DKRZ and GERICS have jointly produced animated visualizations showing the projected key changes in temperature and precipitation for Europe during the 21. Century.
The EURO-CORDEX and ReKliEs-De ensemble of regional climate model (RCM) simulations at 0.11 ° horizontal resolution covering Europe forms the data basis for the videos presented here. The EURO-CORDEX-initiative provides regional climate projections for Europe at 50 km (0.44°) and 12.5 km (0.11°) horizontal resolution and is part of the global CORDEX framework. The WCRP Coordinated Regional Downscaling Experiment (CORDEX (Giorgi et al., 2009)) provides an internationally coordinated framework to improve regional climate scenarios. This includes harmonization of model evaluation activities and the generation of multi-model ensembles of regional climate projections for the land-regions worldwide. The German project ReKliEs-De systematically complemented with additional simulations the existing EURO-CORDEX ensemble.
Each regional climate simulation is forced by a global climate simulation. The global climate simulations are part of the Coupled Model Intercomparison Project Phase 5 (CMIP5), which forms the data basis for the climate projections of the Fifth Assessment Report by the Intergovernmental Panel on Climate Change (IPCC) that was published in 2013. The simulations of CMIP5 are based on Representative Concentration Pathways (RCPs) (van Vuuren et al., 2011). A set of four new pathways (scenarios) was developed for the climate modelling community, which together span the range of radiative forcing values from 2.6 to 8.5 W/m² in 2100. RCP8.5 describes a continuous increase in greenhouse gases, where RCP2.6 represents a mitigation scenario that leads to a radiative forcing around 2040 of 3 W/m² and reduces to the end of the century to 2.6 W/m².
The major goals of CORDEX are to better understand relevant regional/local climate phenomena, their variability and changes, through downscaling. The EURO-CORDEX Ensemble has been evaluated (Kotlarski et al., 2014; Vautard et al., 2013) and forms the data base of many published research papers on future climate change in Europe (e.g. Jacob et al., 2014; Kjellström et al., 2018; Teichmann et al., 2018; Vautard et al., 2014).
| Scenario | GCM/RCM | CLM | REMO | WRF | RCA4 | RACMO | HIRHAM5 |
|---|---|---|---|---|---|---|---|
| EC-EARTH | x | x | x | x | x | ||
| HADGEM2-ES | x | x | x | ||||
| MPI-ESM-LR | xx | x | x | ||||
| RCP2.6 | MIROC5 | x | x | ||||
| IPSL-CM5-LR | x | ||||||
| GFDL-ESM | x |
| Scenario | GCM/RCM | CLM | REMO | WRF | RCA4 | RACMO | HIRHAM5 |
|---|---|---|---|---|---|---|---|
| MPI-ESM-LR | x | xx | x | x | |||
| HADGEM2-ES | x | x | x | x | x | ||
| EC-EARTH | x | x | x | x | xx | x* | |
| RCP8.5 | CAN-ESM | x | x | ||||
| MIROC5 | x | x | |||||
| IPSL-CM5-MR | x | ||||||
| NORESM1 | x |
Table 1: List of all EURO-CORDEX simulations (status August 2018), which have been used to produce the visualizations. Different realizations of the GCM EC-EARTH have been used, most used realization 12, RACMO used realization 12 and additionally realization 1 (RCP8.5), HIRHAM used realization 3*. REMO used realization 1 and 2 of MPI-ESM-LR.
Climate Change Visualizations
With respect to the visualization of the results, the seasonal ensemble mean of the differences between the climate projection data and the seasonal mean of the simulated time period 1971-2000 was calculated. To focus on long term trends instead of short term variability, the visualizations presented are based on 30-year running means. The ensemble mean was calculated on the basis of all simulations available in August 2018 at the ESGF (table 1). The ensemble for RCP8.5 has a different size and different members compared with the ensemble for RCP2.6.
With respect to clear and easy-to-understand visualizations intended for broad audiences, significance levels are not shown in these animations. All visualizations were produced with ParaView, a free software tool that supports 3D visualization. In order to point out correlations between the climate change patterns and the geographic setting, color filled contours were mapped onto the vertically exaggerated 3D representation of the Earth’s topography.
Seasonal temperature change for RCP2.6 and RCP8.5
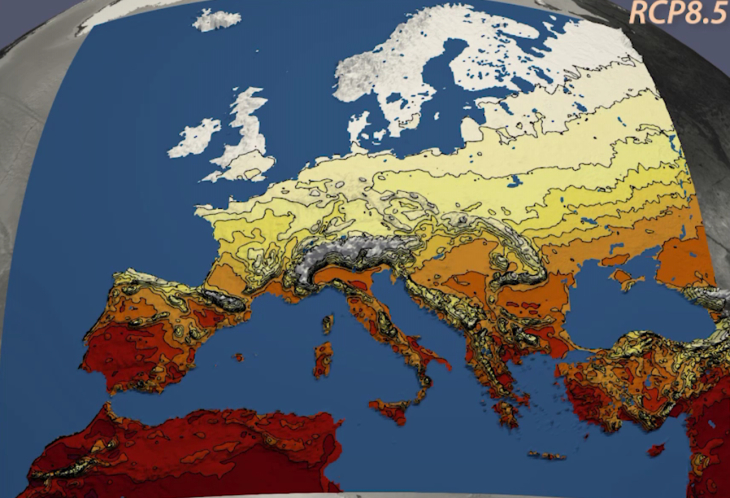
The projected temperature increase is of the order of 1-2°C until 2030. The arctic amplification is distinct by a stronger temperature increase in the far north of Europe. From 2030 onwards, the temperature increases much faster for RCP8.5. Around 2084 (2070-2099), RCP8.5 has developed a strong south-north gradient of 2-8°C in winter. For RCP2.6, the temperature increase tends to stop around 2050 and reaches a smaller south-north gradient of 1-4°C at the end of the 21. century.
In summer, the temperature increase is greatest in the north and in the south for RCP8.5, where it reaches values above 5°C in 2084. In the middle of Europe e.g. England, Germany and the region around the Baltic Sea the summer temperature increases around 3°C. For RCP2.6, the summer temperature increase stays below 2°C over all of Europe (video 1).
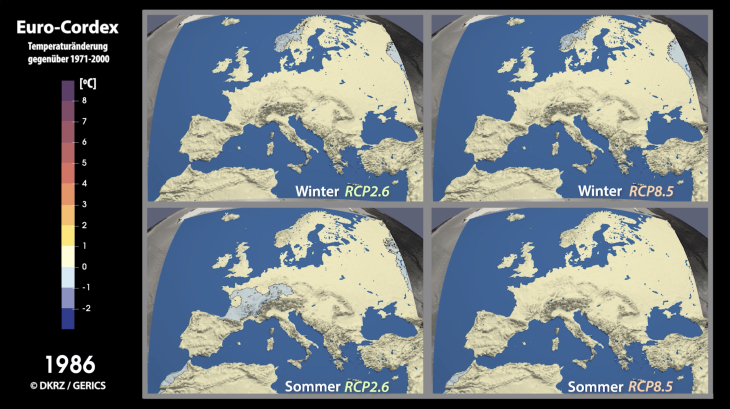 Video 1: The ensemble mean of the temperature change relative to 1971-2000 is presented as a 30-year running seasonal mean, on top for the winter season and at the bottom for the summer season. The left panels show the projected development in summer and winter for RCP2.6, the right panels those for RCP8.5.
Annual change in heat days for RCP2.6 and RCP8.5
The number of heat days (days with daily maximum temperature ≥ 30°C) shows a strong north-south gradient. The number of heat days increases in RCP2.6 and RCP8.5 until 2030. From 2030 onwards, the number of heat days continues to increase only for RCP8.5. The video clearly shows how the lines of the same number of heat days continuously proceed to the North (Video 2a). At the end of the 21. Century the number of heat days has increased by around 15 days/year in southern Europe for RCP2.6. For RCP8.5 the number of heat days is at least 10 additional days/year except for England and Scandinavia, and reaches maximum values in southern Europe of about 70 days/year (Video 2b).
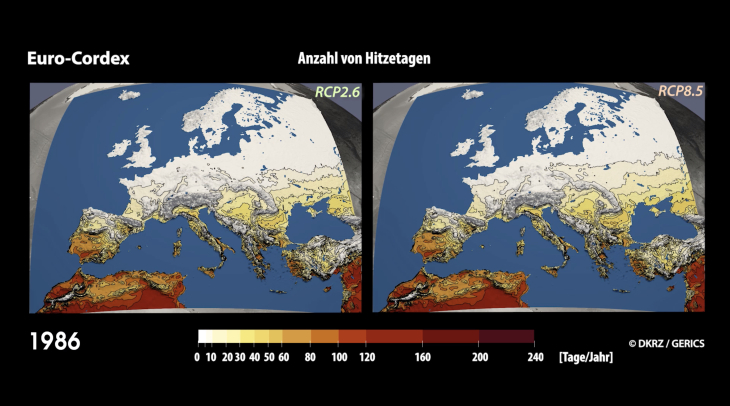 Video 2a: 30-year running mean of the number of heat days (days with daily maximum temperature ≥ 30°C), left for the ensemble of RCP2.6 and right for RCP8.5.
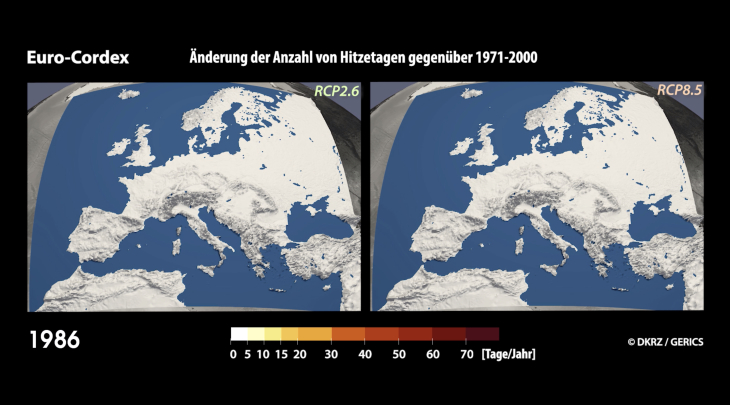 Video 2b: The ensemble mean of the change of number of heat days relative to 1971-2000 is presented as a 30-year running mean, left for the ensemble of RCP2.6 and right of RCP8.5
Seasonal Change in Precipitation for scenario RCP2.6 and RCP8.5
In winter, precipitation has increased around 10% in central Europe and decreased in the south-eastern part of Spain for RCP2.6 and RCP8.5 already by 2020. From then on, this precipitation change pattern intensifies with time, but the signal is more pronounced in RCP8.5, where the precipitation increase in central Europe reaches 25% in 2084.
In summer, the precipitation decreases in southern Europe and increases in the far north of Europe. In southern Europe, the precipitation decrease starts to get more pronounced for RCP8.5 compared to RCP2.6 in 2020. At the end of the 21. Century, the precipitation decrease reaches -40 % in southern Europe while Scandinavia encounters increases of around 5 to 25% for RCP8.5. For RCP2.6, the precipitation change stays below+/-15% (Video 3).
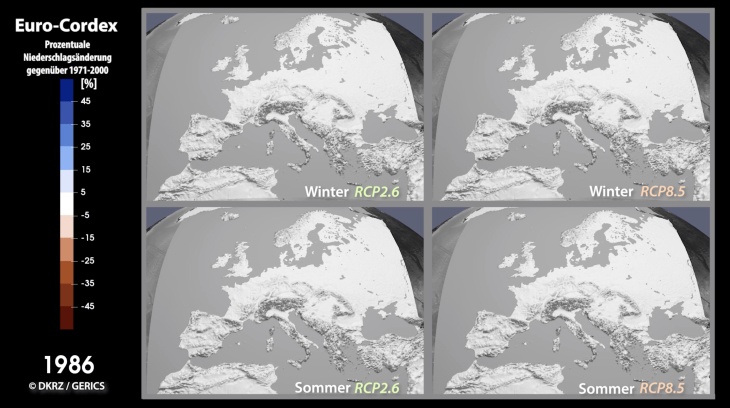 Video 3: The ensemble mean of the precipitation change [%] to (1971-2000) is presented as a 30-year running mean, on top for the winter and at the bottom for the summer season. The left panels show the projected development in summer and winter for RCP2.6 and the right panels those for RCP8.5.
Technical Information about the REMO Simulations
Until August 2018, seven RCP2.6, two RCP4.5 and seven RCP8.5 REMO simulations had been conducted by GERICS at the DKRZ, each for 150 years at 0.11° horizontal resolution over Europe. Each of these simulations needs a simulation with 0.44° horizontal resolution as forcing, also conducted at the DKRZ. Additionally two simulations with a length of approx. 30 years were carried out at 0.11° horizontal resolution and were directly forced with ERA-Interim.
Five of the RCP8.5 simulations were conducted within the ReKliEs-De project which was funded by Federal Ministry of Education and Research under the number 01LK1401.
The EURO-CORDEX region with 0.11° horizontal resolution covers 433x433 grid boxes and 27 vertical levels. REMO uses a time step of 60 s and consumes 527 CPUh for one model month on mistral (12 nodes/ 24 tasks). The results require a storage volume of about 95 Gigabytes per model month. The simulation of one model month takes around 100 minutes in real time.
The EURO-CORDEX Community
EURO-CORDEX is actively supported by 30 modelling groups. It is a voluntary effort of many of the leading and most active institutions in the field of regional climate research in Europe and is coordinated by D. Jacob together with E. Katragkou and S. Sobolowski. EURO-CORDEX (similar to the entire CORDEX initiative) is not providing funding to any participant, but is fully relying on the enthusiasm of the participating researchers and institutions. This enthusiasm is based on the aim to improve climate projections, in order to enable the European society to better adapt to unavoidable climate change and to design more efficient mitigation strategies. (More information: www.euro-cordex.net).
Contact (Authors):
Literature:
Giorgi, F., Jones, C. and Asrar, G. R.: Addressing climate information needs at the regional level: the CORDEX framework, Bull. - World Meteorol. Organ., 58(3), 175–183, 2009. Jacob, D., Petersen, J., Eggert, B., Alias, A., Christensen, O. B., Bouwer, L. M., Braun, A., Colette, A., Déqué, M., Georgievski, G., Georgopoulou, E., Gobiet, A., Menut, L., Nikulin, G., Haensler, A., Hempelmann, N., Jones, C., Keuler, K., Kovats, S., Kröner, N., Kotlarski, S., Kriegsmann, A., Martin, E., van Meijgaard, E., Moseley, C., Pfeifer, S., Preuschmann, S., Radermacher, C., Radtke, K., Rechid, D., Rounsevell, M., Samuelsson, P., Somot, S., Soussana, J. F., Teichmann, C., Valentini, R., Vautard, R., Weber, B. and Yiou, P.: EURO-CORDEX: New high-resolution climate change projections for European impact research, Reg. Environ. Chang., 14(2), 563–578, doi:10.1007/s10113-013-0499-2, 2014. Kjellström, E., Nikulin, G., Strandberg, G., Bøssing Christensen, O., Jacob, D., Keuler, K., Lenderink, G., Van Meijgaard, E., Schär, C., Somot, S., Lund Sørland, S., Teichmann, C. and Vautard, R.: European climate change at global mean temperature increases of 1.5 and 2 °C above pre-industrial conditions as simulated by the EURO-CORDEX regional climate models, Earth Syst. Dyn., 9(2), 459–478, doi:10.5194/esd-9-459-2018, 2018. Kotlarski, S., Keuler, K., Christensen, O. B., Colette, A., Déqué, M., Gobiet, A., Goergen, K., Jacob, D., Lüthi, D., Van Meijgaard, E., Nikulin, G., Schär, C., Teichmann, C., Vautard, R., Warrach-Sagi, K. and Wulfmeyer, V.: Regional climate modeling on European scales: A joint standard evaluation of the EURO-CORDEX RCM ensemble, Geosci. Model Dev., 7(4), 1297–1333, doi:10.5194/gmd-7-1297-2014, 2014. Teichmann, C., Bülow, K., Otto, J., Pfeifer, S., Rechid, D., Sieck, K., Jacob, D., Bülow, K., Otto, J., Pfeifer, S., Rechid, D. and Sieck, K.: Avoiding extremes: Benefits of staying below +1.5 °C compared to +2.0 °C and +3.0 °C global warming, Atmosphere (Basel)., 9(4), 1–19, doi:10.3390/atmos9040115, 2018. Vautard, R., Gobiet, A., Jacob, D., Belda, M., Colette, A., Déqué, M., Fernández, J., García-Díez, M., Goergen, K., Güttler, I., Halenka, T., Karacostas, T., Katragkou, E., Keuler, K., Kotlarski, S., Mayer, S., van Meijgaard, E., Nikulin, G., Patarčić, M., Scinocca, J., Sobolowski, S., Suklitsch, M., Teichmann, C., Warrach-Sagi, K., Wulfmeyer, V. and Yiou, P.: The simulation of European heat waves from an ensemble of regional climate models within the EURO-CORDEX project, Clim. Dyn., 41(9–10), 2555–2575, doi:10.1007/s00382-013-1714-z, 2013. Vautard, R., Gobiet, A., Sobolowski, S., Kjellström, E., Stegehuis, A., Watkiss, P., Mendlik, T., Landgren, O., Nikulin, G., Teichmann, C. and Jacob, D.: The European climate under a 2 °C global warming, Environ. Res. Lett., 9(3), 034006, doi:10.1088/1748-9326/9/3/034006, 2014.
More Videos and Animations
Videos and Animations